July 13, 2022
There’s a very astute observation from the mind of Peter Drucker that says, “what gets measured, gets managed”. The core principle of this idea is that without tangible metrics of performance, a process or task can slip through our fingertips and just become something we do on autopilot – rather than something we’re actively working to improve.
This is especially true in complex workflows like we see in software development where the entire team needs to be operating in an effective way if this is definitely the case. Robust development processes rely on a collaborative effort between team members and the efficiency that can be achieved relies on smoothing out the nuts and bolts of what it takes to create great software. However, it’s surprising that so many development teams don’t dig into this further and look for data solutions that can help them improve their effectiveness.
Leveraging Data to Improve Your Development
By collecting data on how your development workflows are progressing, you can have a much better understanding of where the potential bottlenecks are, how far things are in any particular sprint, and you can compare this performance to benchmarks internally and externally. This data is worth its weight in gold and can help you to get an objective view of how your team is performing.
Too many companies rely on gut instinct and intuition here which is simply not as reliable as we’d like to think it is. Having a single source of truth that everyone can understand goes a long way to creating a fair and merit-based working environment from which better productivity can be achieved.
Of course, the data doesn’t solve things on its own. The key to long-term improvements is to analyze what the data is telling you and to make the necessary shifts to how you do things in order to leverage those insights. For example, when you detect a bottleneck thanks to a data visualizer, you then need to act on that and craft a better process that is going to work for you. This might require new technology, a shift in personnel, changes in policies, or a wide variety of different things. The way that you interpret the data is going to be very unique for your particular organization.
But, when you get it right, it can transform the way that you develop software and give you the confidence to know that the decisions you’re making are based on real data.
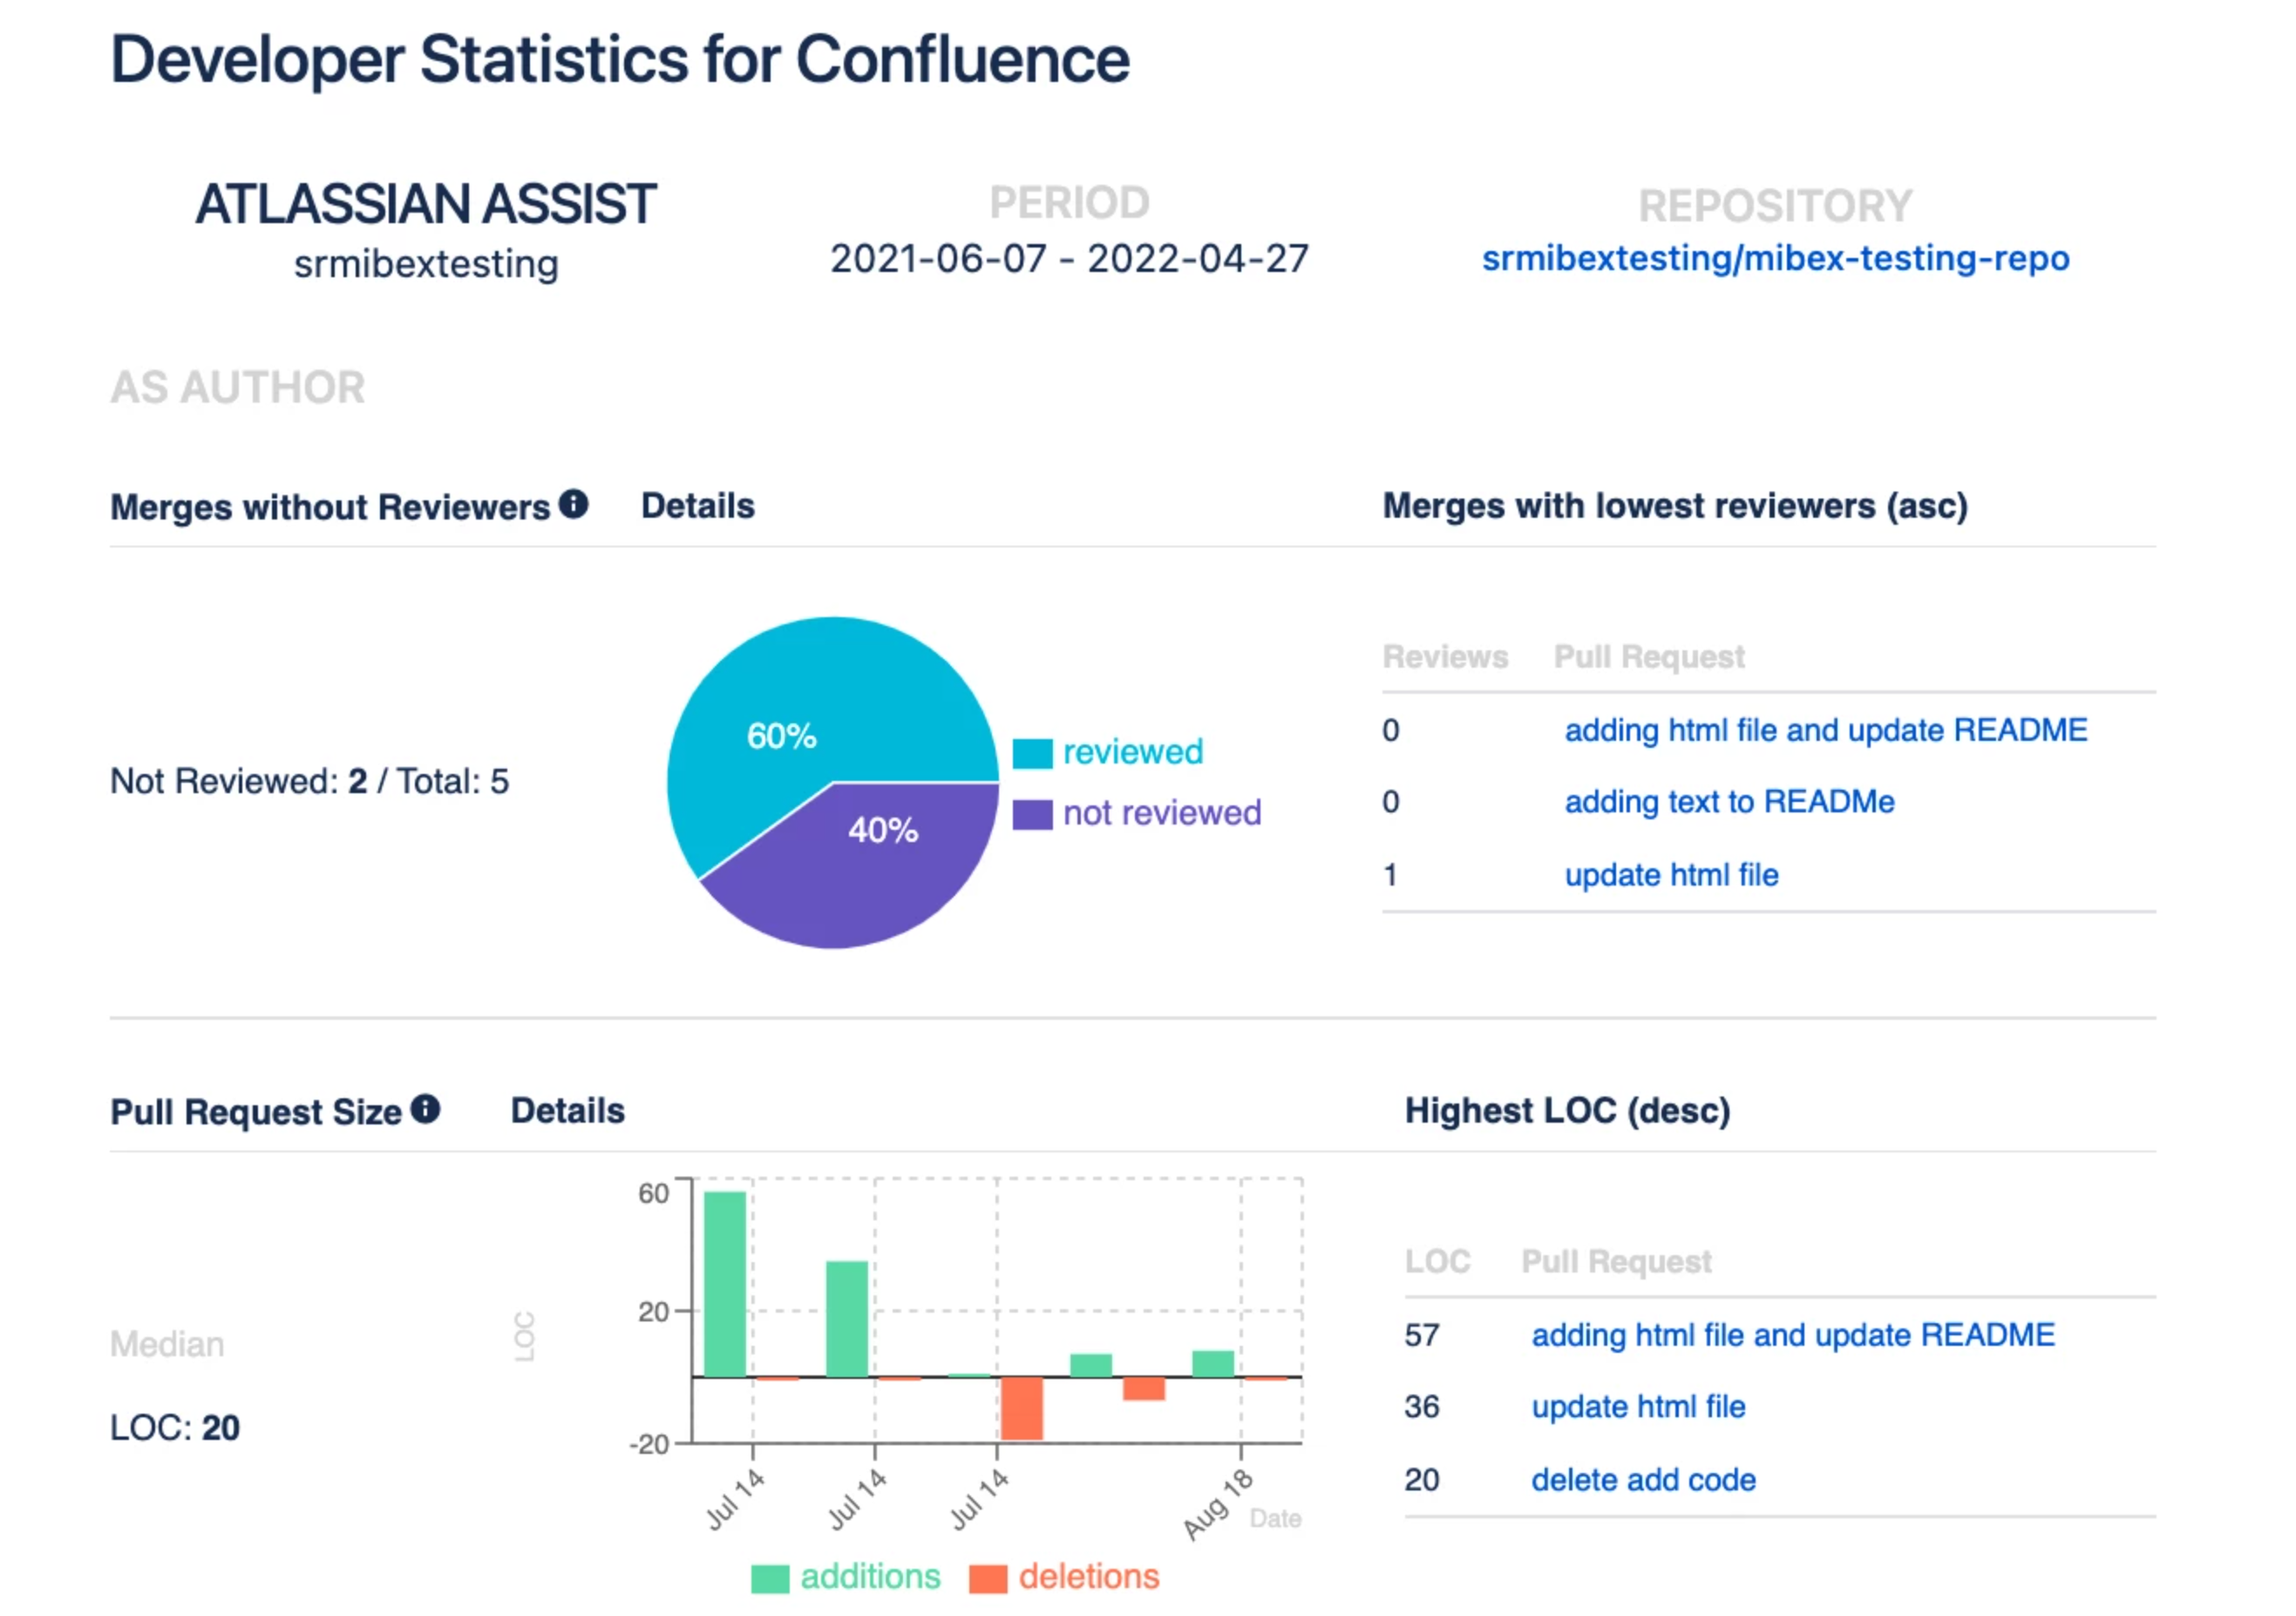
Developer Statistics for Confluence
Here at Mibex we wanted a tool that could fit directly into our workflow and so we created Developer Statistics for Confluence. This tool helps developers and managers to get data-focused insights on the development process so that things can be in a state of continuous improvement. It’s a Confluence integrated macro that can be configured using GitHub or Bitbucket DC, and it provides statistics and visualizations that we find incredibly useful.
We tried to improve the team's collaboration with these metrics, such as Pull Request Lead Time that shows bottlenecks in the Pull Request workflow. Once identified, this can bring only profit to your team, as a detailed analysis of your bottlenecks will help to identify which issues can be fixed.
If you’d like to try it, check it out here and let us know what you think!